High-Res Insights: Sentinel-2 Multispectral Imagery
Posted on June 8, 2024 • 7 min read • 1,478 wordsSentinel-2: Exploring Earth’s surface analysis with multispectral data.

Sentinel 2 Mission
Part of the European Space Agency’s (ESA) Copernicus program, Sentinel-2 has proven to be a game-changer mission for remote sensing technologies. Launched to provide a continuous supply of high-resolution optical imagery, Sentinel-2 offers a wide range of scientific and practical applications.
Sentinel-2 mission includes two identical satellites, Sentinel-2A and Sentinel-2B. These two satellites were launched in 2015 and 2017. They orbit the Earth in a sun-synchronous manner. Sun-synchronous satellites pass over the same region at roughly the same local solar time. This allows temporal comparison of the same area, which could be useful in detecting historical trends and predicting potential trends. Using a MultiSpectral Instrument (MSI) attached to the satellites, users can utilize hyperspectral remote sensing data in 13 spectral bands. Ranging from visible and near-infrared to shortwave infrared, this broad spectral imagery allows users for detailed analysis of Earth’s surface composition and condition. Sentinel-2A and Sentinel-2B were designed for a seven-year operational life and Sentinel-2C and Sentinel-2D are expected to launch in 2024 and 2025 to replace 2-A and 2-B satellites
Technical Specifications and Capabilities of Sentinel-2 Mission
The MultiSpectral sensors on Sentinel-2 offer a big swath width of 290 kilometres. It covers a vast area in a single pass and visits frequently — every 5 days at the equator and even more frequent visits at higher latitudes (approximately every 3 days over the UK). Applications that involves Crop monitoring, Forest management and Disaster response facilitate that high temporal resolution as analyses require up-to-date information.
Sentinel-2’s spectral bands are used for several applications, from basic remote sensing analysis to sophisticated applications. For example, bands in the red edge and shortwave infrared are useful for vegetation monitoring. Combinations of these bands help monitor plant health, biomass production and even species differentiation. The high-resolution bands (10 meters for visible and near-infrared, 20 meters for red edge and shortwave infrared) allow for detailed mapping and monitoring.
Sentinel-2 image data is open and free to access. The Copernicus program’s data policy allows scientists, policymakers and start-ups to use Sentinel-2 imagery without cost.
Applications of High Resolution Satellite imagery

Agriculture: Using Sentinel-2 High-resolution optical imagery, farmers can monitor crop health, estimate yields, and calculate water stress. The normalized difference vegetation index (NDVI) helps assess plant health and optimize irrigation and fertilization schedules.
Forestry: Earth observation ability helps us to monitor forest cover changes, detect illegal logging and assess the impact of natural disasters like wildfires. High-Resolution satellite imagery helps map forest structures and understand biodiversity.
Disaster Response: Sentinel-2 imagery can be used to model floods, monitor volcanic eruptions and assess earthquake damage.
As we continue to face global challenges such as climate change, food security and natural disasters, Sentinel-2’s plays a vital role in providing timely and accurate data. Its contributions to science and society underscore the importance of continued investment in space-based Earth observation technologies.
PART-2: Analysis of Different Bands
In Part 2, we’ll analyse the different bands’ reflectance to determine which are useful in classifying land cover.
Study Area and Data - Salient Details of Imagery
Satellite images used in this analysis are based in the region of southernmost Sweden. The study area we analysed consists of built-up areas, agriculture zones, water bodies, vegetation cover and infrastructure buildings such as roads or rail tracks.
Level-1C and Level-2A Sentinel-2 products are available for users. We used product type Level-1C.
The original Level-1C data (available on ESA SCIHUB) consist of:
100x100 km2 tiles (ortho-images in UTM/WGS84 projection).
Per-pixel radiometric measurements, such as Top-of-Atmosphere (TOA) reflectances, along with other parameters, are transformed into radiances.
Level-1C processing includes radiometric and geometric corrections, ortho-rectification and spatial registration on a global reference system with sub-pixel accuracy. Furthermore, the data also includes the cloud mask. (https://earth.esa.int/web/sentinel/user-guides/sentinel-2-msi/product-types/level-1c)
Note! Satellite imagery provided for this module was resampled to the Swedish geodetic reference system SWEREF99, so no further transformations or re-projections were needed.
The data used in this module consisted of 3 satellite imagery:
Sentinel-2 (10 m spatial resolution) - 4 bands
Sentinel-2 (20 m spatial resolution) - 6 bands
Sentinel-2 (60 m spatial resolution) - 3 bands
Sentinel-2 Bands’ Spectral Information
| Band | Characteristics | Resolution(m) | Central(nm) | |
|---|---|---|---|---|
| B01 | Ultra Blue(Coastal and Aerosol) | 60 | 443 | |
| B02 | Blue | 10 | 490 | |
| B03 | Green | 10 | 560 | |
| B04 | Red | 10 | 665 | |
| B05 | Vegetation Red Edge | 20 | 705 | |
| B06 | Vegetation Red Edge | 20 | 740 | |
| B07 | Vegetation Red Edge | 20 | 783 | |
| B08 | Near-infrared | 10 | 842 | |
| B08A | Vegetation Red Edge | 20 | 865 | |
| B09 | Water vapour | 60 | 945 | |
| B10 | SWIR - Cirrus | 60 | 1375 | |
| B11 | SWIR | 20 | 1610 | |
| B12 | SWIR | 20 | 2190 |
Methods for Enhancing the Image Quality
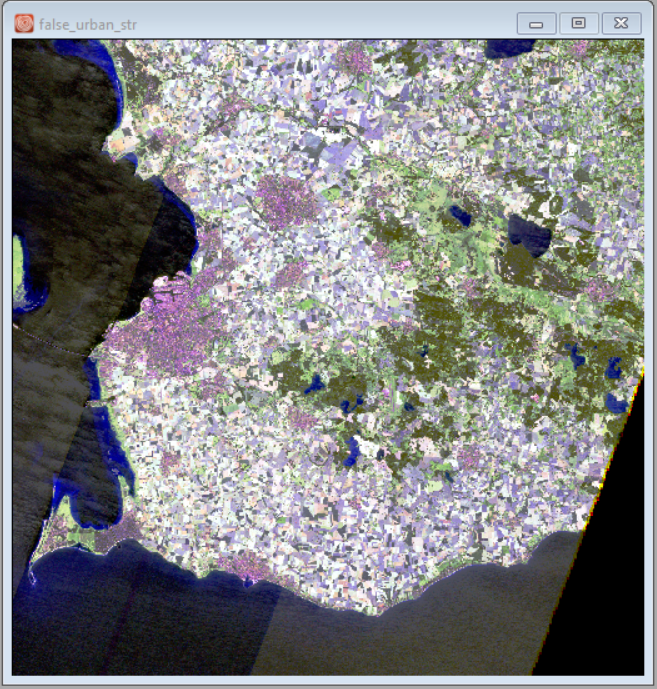
The image enhancement process can be divided into three sections: contrast enhancement, spatial enhancement and spectral enhancement. Visual land class investigation through satellite images requires contrast enhancement to inspect classes by human eyes. Therefore, methods such as stretching a histogram of an image may increase the observed differentiation among classes. Likewise, spatial enhancement methods, low and high pass filters, are used to emphasise or de-emphasise local features, applying weights to the center pixel and its surroundings. Spectral enhancement can be described as the mathematical combinations of multiple bands to produce a derived index. McFEETERS(1996), for example, proposed the Normalized Difference Water Index (NDWI), which combines green and NIR bands to delineate the open water features. Similarly, Normalized difference vegetation index (NDVI) is commonly used for vegetation analysis. Thus, we can utilise NDVI to detect the presence of vegetation. False color (urban) index that combines SWIR1, SWIR2 and RED allows us to distinguish urban areas (appears in white, grey and purple colour).
Image enhancement and Band Combination Results – How It Turned Out?
True Color Composite
In the true color composite, the urban and agricultural areas were quite easy to detect. It was more difficult to distinguish between water bodies and forests: both of those land cover types were displayed as dark due to their low reflectance values.
In the false color composite, the water bodies were much darker than the forests, which were dark red rather than black. Therefore, forests and water bodies were easy to identify and differentiate between.
False Color Urban
RGB composite
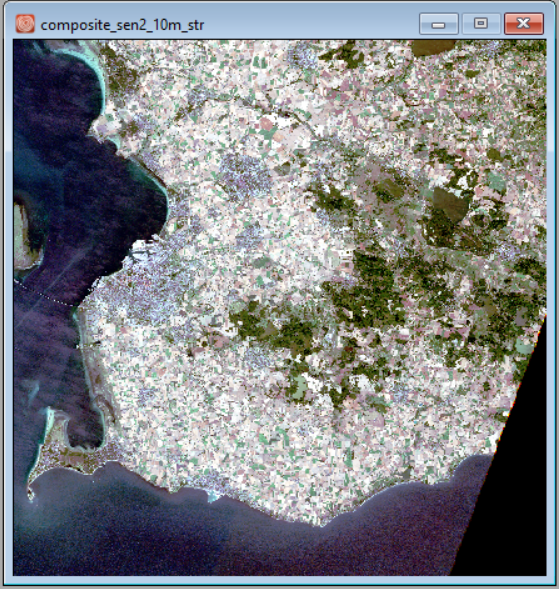
The natural color composite image is a combination of the visible red, green and blue band. Therefore, natural color(RGB) composites display the area in a way how we see the world.
Normalized Difference Water Index (NDWI)
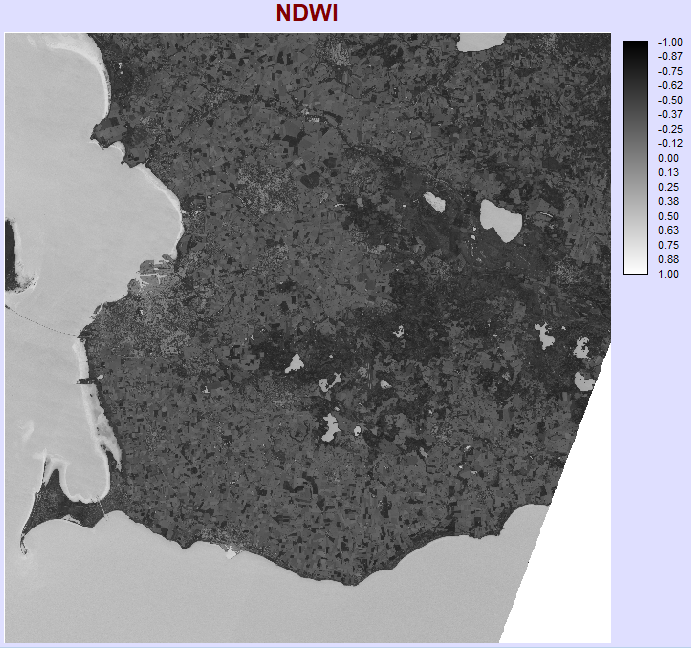
Agriculture zones can be inspected by the shade of white and yellow color. The water bodies are displayed the threshold above 0.3. Thus, the ocean and the lakes can be distinguished by using NDWI, which combines green and near-infrared bands
False Color Composite
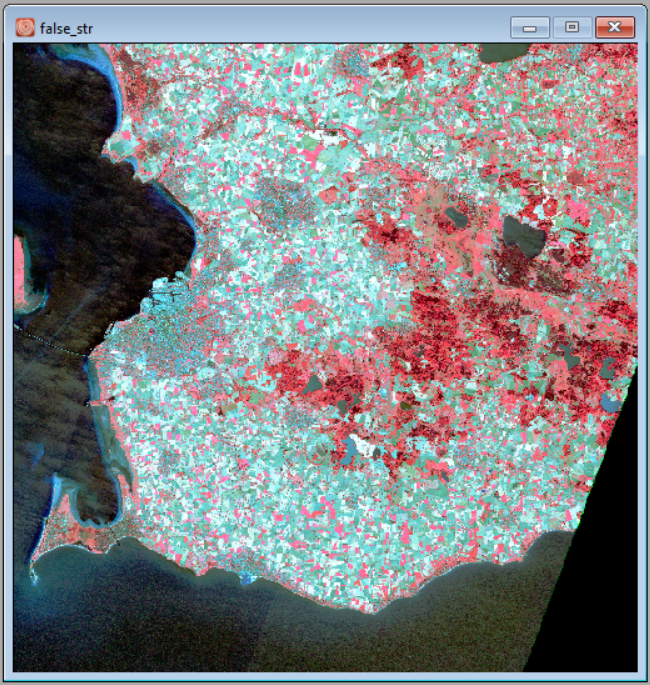
In the False Color Composite image, the forest areas are mainly located in the south-east part of the area (in red color).
Note! Utilizing Sentinel-2 bands, we can identify forest, urban areas, agriculture zones and water bodies.
FAQs
Did it turn out as expected? Why or why not?
The results of making some compositions using different bands allow us to visualise and differentiate different land cover types. Therefore, satellite bands cannot be visually reliable just by analyzing them individually. The Sentinel-2 bands can also be used to create satellite image indices such as NDVI, NWDI, etc.
How are the spectral signatures for vegetation compared to bare soil?
In the NIR band, healthy vegetation has a high reflectance ratio, whereas soil class has less influence than vegetation. On the other hand, In the SWIR band, if we compare the reflectance ratio between forest areas and soil areas, we can see that the reflectance ratio of soil areas varies between 1800 and 2600, while the reflectance ratio of forest areas varies between 500 and 1000.
How can we best utilize the pair of satellite images?
The best utilization of satellite images is to compose appropriate bands to get the most information about the area possible.
What land use classes could we identify in the images?
Water
Forest
Agriculture
Urban
Other Soil Types
What spectral bands are best for detecting roads, water, vegetation etc.?
For the detection of vegetation, NIR (band 8), red band (band 4) and green band (band 3) are being used. Also, calculating NDVI can be useful in order to determine the presence of vegetation. For the roads and other man-made infrastructure, SWIR bands (bands 11&12) in combination with the red band can be used for extracting the correct information. As mentioned above, oceans and water bodies can be determined by using the green band and near-infrared bands. Agriculture lands can be easily recognised by combining near-infrared bands with the blue band (band 2).
Are there any clouds? How can these be removed from the images (to avoid misclassification) and the cloud shadows?
According to the metadata, the data does not contain visible clouds. Atmospheric correction is one way of removing clouds.