GIS Data Modeling using Graphs Theory: Applications in GIS
Posted on February 3, 2025 • 12 min read • 2,402 wordsExplore how graph theory powers GIS: network analysis, spatial relationships & route planning for data insight

Applications of Graph Theory in GIS: Transportation and More
Geospatial technology is a discipline of powerful analytical tools and techniques to solve complex real-world challenges. Graph theory provides a particularly intriguing tool set for geospatial applications, it is the math that provides structure to complex networks and helps understand how things connect and interact. Today we’re delving into the world of graphs, exploring their practical uses in areas beyond mere geography including some you might never have considered. We will be making it very GIS applicable.
What Exactly is Graph Theory Anyway?
Graph theory offers a way of modeling relationships through structures of vertices and edges. Simply put, imagine cities (vertices) connected by roads (edges). That’s a basic graph in the most simplified definition. But this simple abstraction goes deep when considering more intricate network data structures used within geographical information systems or GIS for short.
Building Blocks of Graphs
In formal mathematical notation, a graph G is typically defined as an ordered pair of the sets where $V$ stands for set of vertices also called nodes, and $E$ is set of edges. Mathematically $G= (V, E)$. Each edge has some relationship (also technically a mapping) of its location that corresponds to two vertices, defining the connectivity between spatial features represented by these. Understanding the components are critical when we explore real life examples in GIS analysis. In short every network we build in GIS has at its core, graph based models, from electrical networks, to streets and trails etc..
Basic Terminology
Several key terminologies related to graph based modeling should be familiar to someone working within GIS realm such as:
- Vertices: these can be geographic locations such as intersections, power hubs or natural features like mountain peaks. The way GIS treats it the same way as you have nodes of networks.
- Edges: these links represents relationship between these nodes like roads connecting towns or transmission lines across a region or trails for recreational access, representing movement or flow possibilities
- Degrees: we may talk about nodes degree which means how many vertices a given node is connected to and is key metric to decide different node properties. It is denoted with d(v). For digraphs, we use d+(v) for indegree or arriving and d-(v) out-degree or leaving from nodes, which help modeling unidirectional traffic networks or stream direction flows for hydrographic data.
- Loops: edges start and end at same vertices and in graph terms it is called loops. There are valid cases for such loops but many times are seen a bad data and require cleanup to work with algorithms in graphs.
- Simple Graph: graph that is constructed without the use of loops or parallel edges. In most of cases, that kind of structure are sought out.
- Connected Components: when portions of network are separated and isolated by the fact of no edge connections these structures or sections of data, which do not share edges with other components, are named as connected component.
- Complete Graph Where you will find every vertex connected to every other vertex is called a Complete Graph. There exist only one edge per pairs, and do not feature any loop
- Directed Graphs or Digraph: This concept shows importance of directed nature of roads and flows of energy of material. When edges posses orientation (shown with arrowheads) from node to node a special type of graph arises called Digraph.

Graphs in Geographic Space: A Natural Fit
When you look at how geospatial data are organized they inherently have some relationships, making them great models using graphs. If we start modeling the cities using circles (the vertices) and represent the paths by drawing the links between these cities we’ll intuitively start forming a representation based on the graph theory model. A vast majority of the time you use networks for various types of mapping such as utility maps (water networks, power lines), or street networks, a simple abstract topological graphs with nodes (or vertexes), edges and their relation provide ideal frameworks to work within them, and all such examples from various types of network datasets used in GIS are ultimately rooted in graph based methods. So GIS practitioners should learn them.
Spatial Analysis & Topology with Graphs
Graphs can represent topology which describes how the location of points, edges and polygons with relations with one another are connected irrespective to scale and distortions introduced through projections.
The following key uses highlight their fundamental role in spatial analysis:
Neighborhood Relationships: Through an easy implementation a GIS can determine adjacent zones using graph relationships where graph structure keeps connections as relations. This forms fundamental principle for complex GIS analysis.
Connectivity: determining connected regions within data and which spatial components are adjacent in a given region can also be performed by utilizing connectivity in spatial network graphs
Consistency: Enforcing rule based data integrity by verifying connectedness is what Graph-theory can help as you define edges to correspond topological and consistency for real data sets that need quality checks in various aspects.
Pathways and Routes: GIS analyses can derive topological routes within graph or spatial networks by selecting the shortest path that satisfies specific cost functions (time or distance). This ability also comes from mathematical definition of these edges that link the different nodes (the features of a GIS project.)

Real World Examples
So far the introduction is based more theoretical background let’s look at few practical GIS applications in some real life examples
1) Transportation Networks
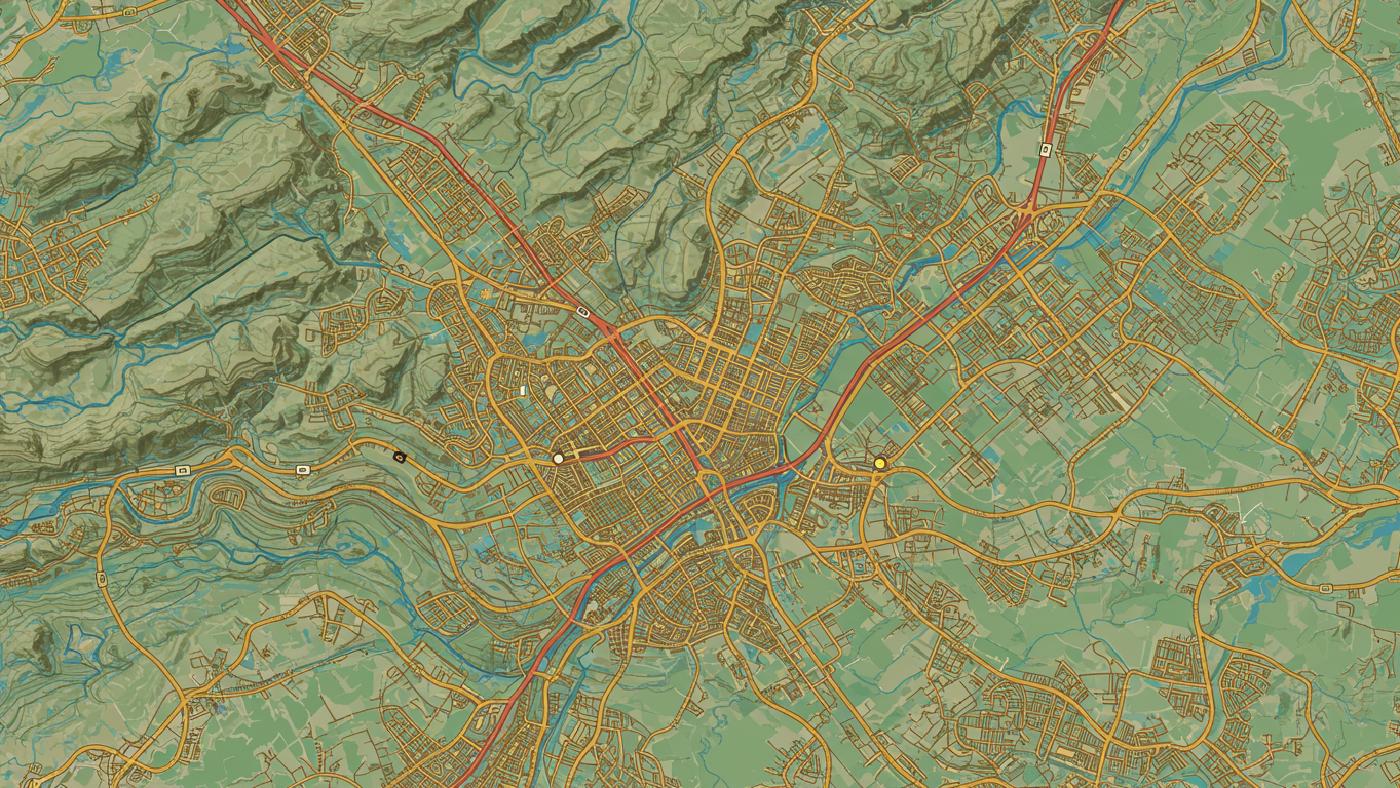
Probably the most important area of applications and where its GIS origin came into existence. Street networks are perhaps one of the very common cases for planning transportation routes, analyzing traffic and access patterns. A road map can very efficiently represented with points at its start and end of every path segment. They’ll connect with each other at an intersection point. Each line segments represent distances as numerical representation to the different arcs. Once that representation is complete the shortest path calculation can use Djikstra’s algorithm which becomes fairly simple to code given this input in matrix or a graph list representation. Using GIS, analysts are better to represent and model their road and network data that is utilized for routing, navigation and emergency service management, all these types of problems find the root by efficient spatial database creation and a lot relies on how well the data are connected with correct directions.

2) Utility Network Management
Electric power and gas line operators use graph based modeling that helps them manage network to ensure consistent flow, this application provides for optimized design, regular maintenance and for dealing with interruptions within these networks. By having accurate data on pipes, the utility provider can assess network redundancy, predict failures due to excessive or inadequate flows or design improvements such as addition and upgrade of components for reliable operations and proper upkeep of their systems. A wide spectrum of analytical function can be developed based on Graph representation for networks. For instance finding isolation nodes in network could serve important use during maintenance work and fault analysis or assessing the areas influenced due to cut offs can improve emergency responses using geospatial datasets of pipes that provide such details to managers.
3) Hydrological Modeling
Water channels that represent natural hydrological environment also fits as spatial network. Analyzing drainage basin, calculating stream orders based on the connectivity or understanding watersheds becomes fairly easy once you define it within the frame of topological graph. A specific problem is about finding flow paths (paths following water streams), a model like it requires to take into account a number of important variables like slopes, and channel conditions to compute accumulation volumes and help understand a basin hydrology as these processes impact ecology as well as management decision about floodplains and water resource utilization within watersheds. Therefore graphs provides robust means to understand and apply different environmental considerations based on graph connectivity as water flows to an eventual river system.

4) Ecology and Wildlife Management
Graphs are an efficient model for studying the structure of the connectivity between wildlife reserves. Spatial relations of ecological niches, corridors (the routes connecting different fragments of suitable environment), fragmentation or analysis of barriers to wildlife movements could not be modeled and analyses easily if such connection or distances can not be easily expressed within the system and how graph theory offers those insights very effectively for these problems, especially during research as well as conservation management for understanding species migration. By identifying important regions acting as connectors or bottle necks and representing habitats using graph structures these analysis is very fundamental. This kind of information can serve the decision makers in resource management agencies that often need planning or maintenance with high levels of consideration of potential impact of the actions.
5) Facility Siting and Location Optimization
Facility sites, whether a post office, police stations, gas stations, or other facilities where distance or route impacts performance becomes important decision that planners take often and requires a good understanding how distances can influence efficiency and reachability. These are examples that fit well in GIS and graph theoretic analyses by using optimal locations while simultaneously maximizing access and minimizing time or resources used during transportation based on spatial proximity, distances and accessibility from a graph. Location analysis also covers multiple facilities to be optimized on which a hub and spoke models, optimal allocation of resources etc become prominent types of modeling. Graph based analysis combined with cost benefits becomes excellent tools. This aspect touches several facets in business.
A deeper look into Graphs: types, traversals and representations
1) Undirected vs. Directed Graphs
In basic form a road connection looks simple since a road segment from two vertices doesn’t offer any insights into one way travel information, and such representations where edges represent connection between points without a specific orientation are undirected graphs. Conversely digraphs include arrows indicating direction from source node to the sink. In transportation network when considering one way road systems (digraph or directed graph) offers clear difference compared to undirected roads systems. That information is important since different analyses may work on this basic assumption whether graph have edges with orientation.

2) Representing the connectivity with data structures
The graphs you design based on your analysis must be representable for computers, with two most frequent data representations in GIS and its analytical aspects : Adjacency matrices and adjacency list. A quick intro.
- Adjacency Matrices uses square matrices for a graph where row i and column j represent connection where one means they connect or ‘adjacent’ to each other while a zero indicated they do not. It is best for simple graphs which don’t have a lot of links
- Adjacency List: this data model uses a list that stores every connection (or edge) from given vertices, its more space saving compared to a dense matrices and is preferred when handling complex networks of many unconnected nodes.
Both of these structural frameworks enables software and analyst to easily implement different algorithm for a graph
3) Navigating Networks: Graph Traversal Algorithms
The purpose is often to use graphs for route generation based on certain priorities such as shortest or fastest routes within the given connections using graph traversals which are basic techniques. One way is DFS (or Depth-first-search). Such as algorithm uses stacks for traversing, you explore the path deeper into its node’s edges or neighborhood before returning the starting vertex. BFS on the other hand does search broadly going to next levels on all neighboring vertices from the current vertex by employing queues for data. Shortest Path algorithms, e.g. Djikstra, aim to find the optimal lowest distance path on networks and for specific set of optimization goal that satisfies specific application criteria within graphs. Such techniques form core analysis tools with route finding that is being done many times in logistics management to everyday commute on digital mapping tools and is part of navigation that people use worldwide, in these cases distance is also a factor (weight in graph).
Eulerian and Hamiltonian Graphs
When considering how one can tour these spatial datasets, it brings a lot of interesting problems such as a simple problem on if someone has to travel through a graph by traversing each edge exactly one is an Eulerian graph traversal that often appear in cases like garbage collection, bus planning or parcel delivery systems. A second tour problem concerns if it possible for one tour that involves visiting all vertices, it’s is a Hamiltonian circuit finding the optimum solution for each of such scenarios depends on what you look as criteria, sometimes it involves distance (Travelling Salesman problem which is very important area for logistics).
Graph properties for solving complex problems.
While we discuss these traversal aspects lets summarize all what Graph theoretic studies provide. From the study of path optimization, flow capacity to pattern analyses and clustering. There is plethora of real world spatial challenges can be understood, analyzed, and improved when GIS adopts graph representations of real-world data and then utilize appropriate algorithm to bring results for data analysis. A lot of what we understand with human connectivity using data comes through different graphs analyses based on topological representations.
Conclusion
Graph theory might sound overly complex at first glance, and even esoteric since it is grounded within discrete math but in practice a number of GIS-specific software can assist and do help implementing analysis in geospatial space that are based on its methods that is built by applying basic set theory and relationships of features (topology and structure). If you’re looking to explore spatial connections, optimise logistical processes or understanding complex environmental changes , learning this basic math is invaluable that not only can open new horizons, also enhances analytical abilities as it is increasingly used in diverse spatial modeling to support sophisticated decisions and insight for the most basic day-to-day analysis all the way through to cutting edge scientific experiments and explorations. The future of data management is also based on graph type frameworks that we see evolving through the usage of Linked Data on Web for instance. With its solid mathematical foundations it also help the understanding on limitations as well to guide researchers within this new territory with strong footing to advance new modeling systems that uses mathematical structure and insights derived for the same purposes in real world and more challenging problems.