Enhanced Urban Planning Using Deep Learning Methods: Dashcam Video Analytics
Posted on January 25, 2025 • 10 min read • 2,103 wordsAI analysis of dashcam video provides a new way to measure pedestrian traffic & improve urban planning
Unveiling Pedestrian Dynamics: How AI and Dashcam Data Revolutionize Urban Mobility Analysis
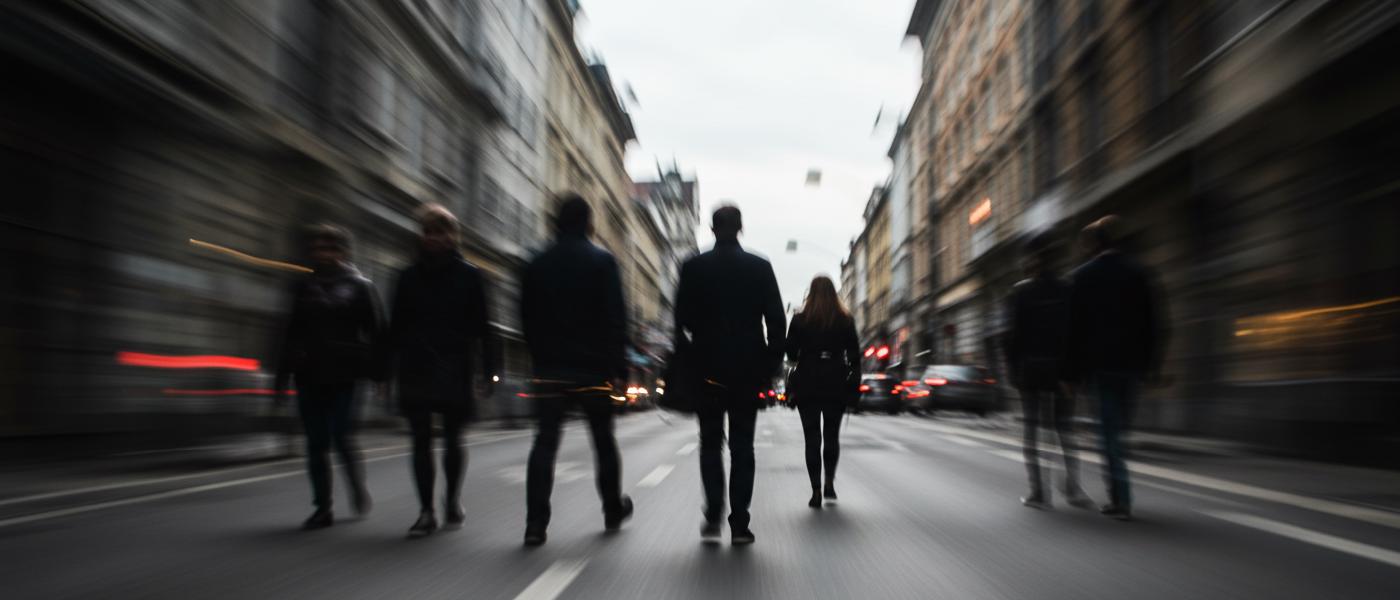
The movement of people, the ebb and flow of pedestrians through our cities, forms the very pulse of urban life. Yet, unlike vehicle traffic, which is heavily monitored, detailed data on pedestrian flows remains surprisingly scarce. This lack of systematic data collection creates a gap in our understanding, especially when planning for walkable, safe urban environments. This article delves into an innovative approach for gathering this essential information, utilizing the ever-present resource of bus dashcam footage, computer vision and advanced deep learning methods. We explore the data, methodologies, insights and real world implications behind this approach.
The Challenge of Capturing Pedestrian Flows
For a long time the study of urban environments heavily prioritized vehicle data, leaving pedestrian movement often in the background. But people aren’t always going places in cars, are they? And a lot of time and money is poured into getting this vehicle data. So a common issue is data on pedestrians usually isn’t regularly collected. For some it might be manual counts in some busy parts of the city, but these are limited, usually for one point for one set of time. Or they try to extrapolate it based on census data, but this just gives very general estimates. Other more direct measurement methods like deploying sensors can be costly, and have low coverage across a whole city, hence they are usually less attractive to cities looking for robust data to back urban planning decisions. As technology develops though, new data becomes more accessible offering great benefits, and more creative solutions are constantly being implemented, like the utilization of existing technologies.
Leveraging Bus Dashcams for a New Perspective
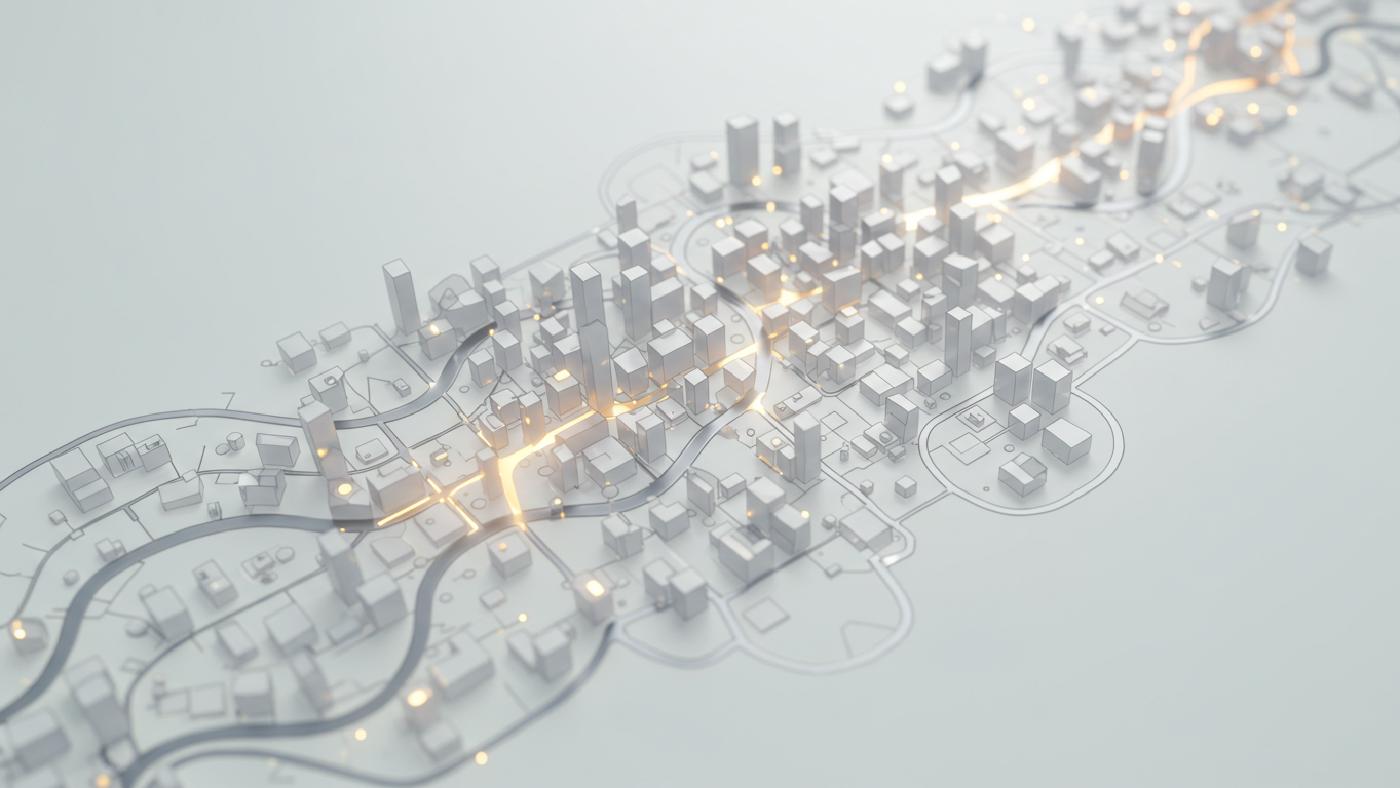
Recognizing the gaps in our data, some research started thinking differently and asking a slightly different question; where can we obtain pedestrian data cost effectively at scale, regularly. Turns out the answer was hidden right under our noses (or, actually on the dashboards). In places with decent bus transit infrastructure the sheer quantity of buses constantly moving all across city means they often end up seeing and traveling every part of a city over time, multiple times per day. If there’s video of this movement, which it turns out many of them already do, we have access to a completely new approach to data collection. This has massive potential in capturing large-scale pedestrian activity data at city scale and at low costs. This study made this a reality, using video footage taken from bus dashboards and deep learning methods to automatically collect pedestrian data, providing an important data source that can enable smarter and more evidence-based urban planning decisions.
Decoding Urban Spaces: The Methodology
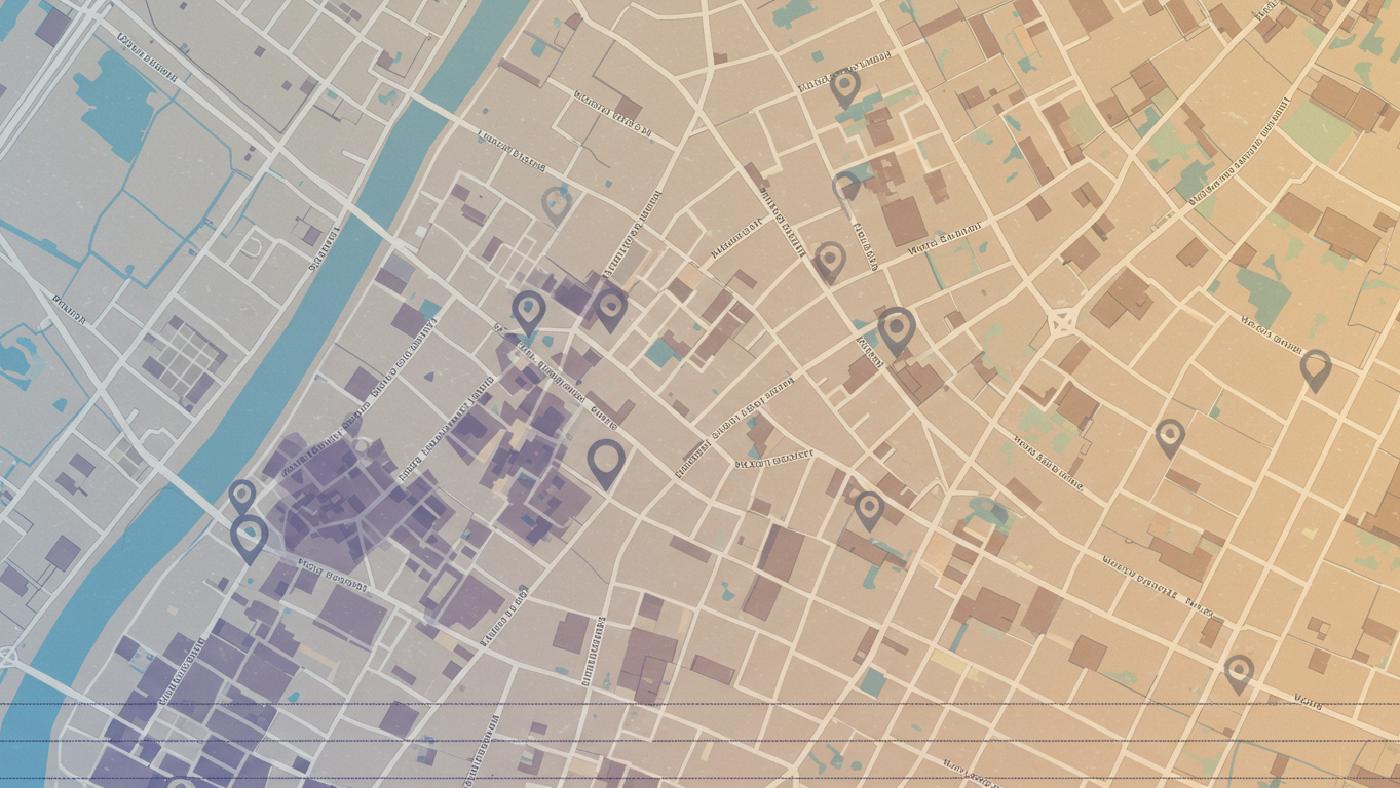
The team did more than just capture video footage, though; it involved some high powered tools, namely, object detection tracking. At its core, this study uses a clever fusion of machine learning tools that involve Fast R-CNN algorithm for spotting objects (including pedestrians), plus Deepsort algorithm, which allows computers to then track these pedestrians through time and through video footage. As a bus is traveling along roads a system captures each frame, then spots and tracks these moving individuals. This data is also correlated to timestamps and precise GPS positions meaning each pedestrians spotted are recorded for precise points along roads over specific periods. Then, some clever calculations turn this all into a hourly pedestrian volume number, considering variables like walking speeds and also adjusting for fluctuations in bus travel speeds across certain roads.
What did this data gathering result in, I hear you ask? Well it resulted in multiple different data streams from different technologies for a rich and full set of comparable outputs. To give a comparison to what else was available, the pedestrian estimates from bus dashboard was juxtaposed against measures that other professionals might use, to demonstrate and better articulate the value of the approach they were implementing. They developed and contrasted with two common approaches for generating this information. Firstly, extracting number of walking trips from national travel survey datasets. Secondly, employing Google Street View to extract number of pedestrian from those. Both common techniques used as alternative proxies for how much foot traffic and general pedestrian presence on roads and streets. These different estimates allowed for different things to be taken into consideration when analyzing traffic accidents, offering new angles in tackling pedestrian safety, more on this in a second.
Validating the Insights: Matching Estimates with Reality
With such high-powered analytics you must wonder, how well did the estimated pedestrian numbers match up with reality. Turns out pretty good actually. The researchers picked out some five places on main road locations for validation through real, live, on site counting over three time periods for busy time points in the day. They took these live data and then cross referenced with all 3 estimate output of each location. What did it show? well, that pedestrian counts from the bus data did better with real time human measurements. That means the results showed that dashcam methodology proved more consistent with manual counts and less susceptible to generalisations like survey and picture methodologies. Showing a significant advantage when making use of video data rather than other proxy measures for generating pedestrian numbers in urban places. The data from survey and image could sometimes be off, so this confirmed there’s a valuable element in going to the video for counting people. To put some numbers on it all, a high concordance correlation coefficient between video count and manual count data suggests this type of data should be taken as an important factor to use and develop as this type of information stream improves, rather than just the alternative options often considered in the past. So what’s next, after these data streams? It turns out they took things to the next level as an example of application for pedestrian road safety measures.
Putting Data to Work: Modeling Pedestrian-Vehicle Crashes
The heart of this research wasn’t just about counting pedestrians but what such information does, and how the resulting numbers can enhance current methods. It turns out this research developed road safety models based on this very same data in different segments of a major city; both with and without pedestrian crossings to establish if data changes model results, and by extension if it might change how traffic models can improve the safety of all city goers.
A few points on this modelling and how its all connected; there were about twenty-four different parameters included from different kinds of geospatial analysis to generate comprehensive insight on crashes for certain areas of a major city, some static parameters, like presence of crossings or bus stops. Or number of shop categories nearby or number of heavy vehicles as examples of parameters. This modelling used common approaches to assess accident frequency. It tested multiple statistical models including some deep learning approaches as it aimed to understand not only what parameters caused a change in crashes, but also what methods best reflect such a complex challenge and what might change how cities respond to traffic accidents moving forward. Turns out these approaches allowed very comprehensive real life results from this project, including clear insights to the influence that video analytics methodology can bring when tackling challenges faced when enhancing transport planning policy in large dense city areas, such as improving urban planning road safety policy for all who interact within our shared built spaces.
What the Models Reveal: Key Factors and the Importance of Place
Let’s get into the weeds a little more here. As alluded to previously, road sections with crossing behaved differently than segments without them. Specifically, there is a higher risk with heavy vehicles in pedestrian crashes where no crossings were involved. Roads with crossings often benefit from other supporting and related policy and protections like signalised lights, markings, protected walkways etc. Which is in contrast to the nature of locations mid-block, for example, or small side streets with minimal protections often feature greater degrees of crashes due to higher risk from heavy vehicles, plus high degrees of pedestrian misbehaviour, all indicating more focus required there when thinking about general transport planning road policy design and implementation.
From this detailed traffic data a few common patterns popped up, regardless of crossing existence; high numbers of pedestrians naturally correlate to higher numbers of collisions; more retail and eating place spots increase pedestrian accidents; more public finance spots often lead to high risk; lastly, surprisingly, places with higher vehicle speed have less crashes, possibly indicating people are more careful with the increased risk of high traffic situations or better policies and safeguards usually located around those routes and locations in urban centers. In turn showing that road design might need an urban design review as people behave differently under high speeds as opposed to places they might think are less threatening to people.
But for locations without crossings there is even more insight; sidewalks seem to bring high incidence rates to crash locations in these types of areas; plus collisions seem to rise with frequency outside busy morning commute times; plus roads of secondary and minor function seemed to have a greater danger to pedestrian traffic compared to major routes; all these indicate focus needs to be directed at such types of zones across cities to create a much safer transit landscape for all citizens and commuters. This further demonstrates just how important pedestrian tracking information can be for developing safer streets. This highlights that, to build better road safety policies in cities, focusing only on areas that feature formal crossings will leave a great amount of risk factors unaccounted for and that policy must incorporate all road users in its approach. This also underscores that in this project deep analytics is also showing that human behavior can often override conventional traffic and route design thinking as pedestrians and vehicles act independently and respond to their perceived environment and immediate need more often than anticipated. And it also showed the benefits of integrating different approaches for the complex world that our shared transport systems actually occupy.
Moving Forward: Opportunities for Future Development
So what is next with pedestrian video data? Well as of today data and video is cheaper to gather and analyze. So methods like the dashcam methods are improving day by day. And it also showed something important; different methods are actually good at answering different questions, they often complement each other not replace one another as tools. Different data streams from different sources, whether image analysis or surveying, video collection or live point samples all showed a significant difference with how they represent real life phenomenon, so, as time and resources are more available, the more of these sources one can take into account in city data the more comprehensive traffic data is available, giving all city stake holders and traffic planning professionals a better grasp on the urban environments and by extension build more humane urban transport ecosystems. All things taken together makes cities much more usable, understandable and of course; safe. This also provides an ethical option too that uses an existing infrastructure, not further expanding our technology footprints, especially with how privacy of personal data needs to be factored in at a planning policy stage for these new approaches to collection. The use of video anonymisation approaches such as AI powered blur out systems on camera sources demonstrates this in the application, and must always be part of all systems like these in any practical or large scale real world application or roll outs in any context where humans might feature.
Moving forward for professional practices with traffic design and policy development, there is great promise to test different collection, modeling and analysis tools. Cities need different kinds of data, from a variety of places, all for improving real world impact, all of which improves transport planning practices for future iterations and development across urban centers all over the world.
By tapping into the potential of AI and readily available resources like dashcams, urban planners, transport professionals, as well as anyone who participates in and interacts in urban space, are in a much better position now to truly understand pedestrian flows, better enabling safer and more vibrant cities that prioritise every body within our streets not only vehicles. These insights can help create more pedestrian-friendly spaces in existing cities, plus create smart infrastructure systems and policy that responds to our needs moving forward. This information improves urban planning practices. Plus makes more inclusive street level policies based on new technological potential all within grasp with recent geospatial developments.